2012 U.S. presidential election Democratic Party Republican Party Related races
The Republican primary took place on March 13, 2012, the same day as the Alabama Republican primary and the Hawaii Republican caucuses .[5] [6] [7]
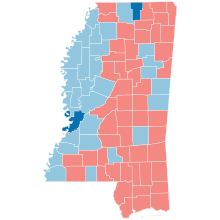
General election Results By county County Mitt Romney Barack Obama Various candidates Margin Total # % # % # % # % Adams 6,293 40.74% 9,061 58.66% 93 0.60% -2,768 -17.92% 15,447 Alcorn 11,111 74.92% 3,511 23.67% 208 1.41% 7,600 51.25% 14,830 Amite 4,414 57.28% 3,242 42.07% 50 0.65% 1,172 15.21% 7,706 Attala 5,126 56.38% 3,927 43.19% 39 0.43% 1,199 13.19% 9,092 Benton 2,041 49.59% 2,051 49.83% 24 0.58% -10 -0.24% 4,116 Bolivar 4,701 30.47% 10,582 68.59% 145 0.94% -5,881 -38.12% 15,428 Calhoun 4,412 62.42% 2,586 36.59% 70 0.99% 1,826 25.83% 7,068 Carroll 3,960 66.09% 2,007 33.49% 25 0.42% 1,953 32.60% 5,992 Chickasaw 3,994 46.97% 4,378 51.49% 131 1.54% -384 -4.52% 8,503 Choctaw 2,812 65.81% 1,428 33.42% 33 0.77% 1,384 32.39% 4,273 Claiborne 625 11.40% 4,838 88.22% 21 0.38% -4,213 -76.82% 5,484 Clarke 5,049 61.18% 3,111 37.70% 93 1.12% 1,938 23.48% 8,253 Clay 4,291 38.76% 6,712 60.62% 69 0.62% -2,421 -21.86% 11,072 Coahoma 2,712 25.71% 7,792 73.86% 45 0.43% -5,080 -48.15% 10,549 Copiah 6,282 44.48% 7,749 54.87% 92 0.65% -1,467 -10.39% 14,123 Covington 5,405 57.82% 3,878 41.48% 65 0.70% 1,527 16.34% 9,348 DeSoto 43,559 66.21% 21,575 32.79% 660 1.00% 21,984 33.42% 65,794 Forrest 16,574 54.82% 13,272 43.89% 390 1.29% 3,302 10.93% 30,236 Franklin 2,735 60.87% 1,726 38.42% 32 0.71% 1,009 22.45% 4,493 George 8,376 84.98% 1,359 13.79% 121 1.23% 7,017 71.19% 9,856 Greene 4,531 76.51% 1,325 22.37% 66 1.12% 3,206 54.14% 5,922 Grenada 5,986 52.81% 5,288 46.65% 61 0.54% 698 6.16% 11,335 Hancock 12,964 75.52% 3,917 22.82% 286 1.66% 9,047 52.70% 17,167 Harrison 39,470 62.33% 23,119 36.51% 739 1.16% 16,351 25.82% 63,328 Hinds 29,664 27.86% 76,112 71.47% 715 0.67% -46,448 -43.61% 106,491 Holmes 1,435 15.45% 7,812 84.11% 41 0.44% -6,377 -68.66% 9,288 Humphreys 1,293 24.81% 3,903 74.88% 16 0.31% -2,610 -50.07% 5,212 Issaquena 302 38.37% 479 60.86% 6 0.77% -177 -22.49% 787 Itawamba 7,393 79.34% 1,706 18.31% 219 2.35% 5,687 61.03% 9,318 Jackson 35,747 66.62% 17,299 32.24% 609 1.14% 18,448 34.38% 53,655 Jasper 4,193 44.89% 5,097 54.57% 50 0.54% -904 -9.68% 9,340 Jefferson 468 10.56% 3,951 89.13% 14 0.31% -3,483 -78.57% 4,433 Jefferson Davis 2,507 36.52% 4,267 62.16% 90 1.32% -1,760 -25.64% 6,864 Jones 20,687 68.59% 9,211 30.54% 261 0.87% 11,476 38.05% 30,159 Kemper 1,789 35.41% 3,239 64.11% 24 0.48% -1,450 -28.70% 5,052 Lafayette 11,075 56.78% 8,091 41.48% 339 1.74% 2,984 15.30% 19,505 Lamar 19,101 76.74% 5,494 22.07% 294 1.19% 13,607 54.67% 24,889 Lauderdale 18,700 57.05% 13,814 42.15% 263 0.80% 4,886 14.90% 32,777 Lawrence 4,192 62.59% 2,468 36.85% 38 0.56% 1,724 25.74% 6,698 Leake 4,863 54.14% 4,079 45.41% 41 0.45% 784 8.73% 8,983 Lee 22,415 63.49% 12,563 35.58% 328 0.93% 9,852 27.91% 35,306 Leflore 3,587 28.08% 9,119 71.39% 67 0.53% -5,532 -43.31% 12,773 Lincoln 10,839 66.04% 5,471 33.33% 104 0.63% 5,368 32.71% 16,414 Lowndes 13,518 49.78% 13,388 49.30% 252 0.92% 130 0.48% 27,158 Madison 28,507 57.51% 20,722 41.80% 342 0.69% 7,785 15.71% 49,571 Marion 8,237 64.71% 4,393 34.51% 99 0.78% 3,844 30.20% 12,729 Marshall 6,473 39.86% 9,650 59.42% 117 0.72% -3,177 -19.56% 16,240 Monroe 9,723 57.47% 7,056 41.71% 139 0.82% 2,667 15.76% 16,918 Montgomery 2,947 52.21% 2,675 47.39% 23 0.40% 272 4.82% 5,645 Neshoba 7,837 71.15% 3,089 28.04% 89 0.81% 4,748 43.11% 11,015 Newton 6,394 65.40% 3,319 33.95% 64 0.65% 3,075 31.45% 9,777 Noxubee 1,325 21.15% 4,920 78.54% 19 0.31% -3,595 -57.39% 6,264 Oktibbeha 8,761 48.36% 9,095 50.20% 261 1.44% -334 -1.84% 18,117 Panola 7,629 45.34% 9,079 53.96% 118 0.70% -1,450 -8.62% 16,826 Pearl River 17,549 78.96% 4,366 19.65% 309 1.39% 13,183 59.31% 22,224 Perry 4,137 72.30% 1,527 26.69% 58 1.01% 2,610 45.61% 5,722 Pike 8,181 45.52% 9,650 53.69% 143 0.79% -1,469 -8.17% 17,974 Pontotoc 9,448 76.13% 2,804 22.59% 159 1.28% 6,644 53.54% 12,411 Prentiss 7,075 70.52% 2,817 28.08% 141 1.40% 4,258 42.44% 10,033 Quitman 1,116 28.05% 2,837 71.30% 26 0.65% -1,721 -43.25% 3,979 Rankin 48,444 75.52% 14,988 23.37% 713 1.11% 33,456 52.15% 64,145 Scott 6,089 54.36% 5,031 44.91% 82 0.73% 1,058 9.45% 11,202 Sharkey 737 29.11% 1,782 70.38% 13 0.51% -1,045 -41.27% 2,532 Simpson 7,424 60.61% 4,723 38.56% 102 0.83% 2,701 22.05% 12,249 Smith 6,049 74.69% 1,979 24.44% 71 0.87% 4,070 50.25% 8,099 Stone 5,420 71.96% 2,003 26.59% 109 1.45% 3,417 45.37% 7,532 Sunflower 2,929 26.09% 8,199 73.02% 100 0.89% -5,270 -46.93% 11,228 Tallahatchie 2,499 38.43% 3,959 60.88% 45 0.69% -1,460 -22.45% 6,503 Tate 7,332 59.10% 4,933 39.76% 141 1.14% 2,399 19.34% 12,406 Tippah 6,717 73.30% 2,317 25.28% 130 1.42% 4,400 48.02% 9,164 Tishomingo 6,133 77.28% 1,643 20.70% 160 2.02% 4,490 56.58% 7,936 Tunica 883 20.15% 3,475 79.30% 24 0.55% -2,592 -59.15% 4,382 Union 8,498 74.77% 2,742 24.13% 125 1.10% 5,756 50.64% 11,365 Walthall 4,051 53.65% 3,422 45.32% 78 1.03% 629 8.33% 7,551 Warren 10,457 48.89% 10,786 50.42% 148 0.69% -329 -1.53% 21,391 Washington 5,651 28.66% 13,981 70.92% 83 0.42% -8,330 -42.26% 19,715 Wayne 6,111 59.15% 4,148 40.15% 73 0.70% 1,963 19.00% 10,332 Webster 3,992 76.27% 1,190 22.74% 52 0.99% 2,802 53.53% 5,234 Wilkinson 1,415 29.16% 3,412 70.31% 26 0.53% -1,997 -41.15% 4,853 Winston 5,168 52.58% 4,607 46.87% 54 0.55% 561 5.71% 9,829 Yalobusha 3,276 51.56% 3,030 47.69% 48 0.75% 246 3.87% 6,354 Yazoo 4,941 42.52% 6,603 56.82% 76 0.66% -1,662 -14.30% 11,620 Totals 710,746 55.29% 562,949 43.79% 11,889 0.92% 147,797 11.50% 1,285,584
County Flips: Democratic Hold
Gain from Republican
Republican Hold
Counties that flipped from Republican to Democratic By congressional district Romney won 3 of 4 congressional districts.[10]
See also References ^ "2012 Presidential Election Results - Mississippi". Retrieved January 5, 2013 . ^ "2012 Exit Polls - Mississippi". CNN . Retrieved January 5, 2013 . ^ Kestenbaum, Lawrence . "Warren County, Mississippi". The Political Graveyard . Retrieved December 29, 2022 .^ "Mississippi Democratic Delegation 2012". The Green Papers . Retrieved August 1, 2019 . ^ "Primary and Caucus Printable Calendar". CNN . Retrieved January 11, 2012 . ^ "Presidential Primary Dates" (PDF) . Federal Election Commission . Retrieved January 23, 2012 . ^ "Mississippi Republican Delegation 2012". www.thegreenpapers.com . ^ "Republican%20Certification_2012%20Primary.pdf" (PDF) . ^ "Mississippi Republican Primary - Election Results - Election 2012". The New York Times . ^ "Daily Kos Elections' statewide election results by congressional and legislative districts". Daily Kos . Retrieved August 11, 2020 . External links The Green Papers: for Mississippi The Green Papers: Major state elections in chronological order
U.S. U.S. U.S.(Election Governors Attorneys Other State Arizona California Connecticut Delaware Florida Hawaii Illinois Iowa Michigan Minnesota Montana New Mexico New York North Carolina Oregon Pennsylvania Texas Washington Wisconsin Mayoral Alexandria, VA Anchorage, AK Augusta, GA Austin, TX Bakersfield, CA Baton Rouge, LA Cheyenne, WY Corpus Christi, TX Fort Lauderdale, FL Fresno, CA Glendale, AZ Honolulu, HI Huntsville, AL Irvine, CA Juneau, AK Lubbock, TX Mesa, AZ Miami-Dade County, FL Milwaukee, WI Orlando, FL Portland, OR Richmond, VA Riverside, CA Sacramento, CA San Diego, CA San Juan, PR Santa Ana, CA Stockton, CA Virginia Beach, VA Wilmington, DE States and
Democratic Party
Republican Party
Libertarian Party
Green Party
Election timelines National opinion polling State opinion polling Fundraising Debates and forums Straw polls Major events Caucuses primaries
Results breakdown National
Reforms